During my internship at Catch New York Agency, I collaborated with a team to create an acquisition email series campaign targeted at eligible organization members for Parachute Digital Solutions, an end-to-end insurance platform. In this process, I conducted market research and analyzed data in order to segment customers, as well as iterated on the visual design of the emails for two products: Cancer Insurance and Sr. Term Life Insurance.
Some mid to lower level insurance plans do not provide cancer coverage or life insurance. Oftentimes, people believe that they are healthy will not get cancer or are unaware of the need for coverage via an email campaign.
To inform people about potential health risks and how they can take control of their health, Parachute is partnering with organizations to promote an exclusive offer for members
through a marketing email campaign.
In order to create segments for the email campaign, I interpreted SHAP values for different features (ex. age, income) which indicate closeness to the average prediction, measuring consumer behavior.
A negative correlation between variables indicates that as the variable tested increases, consumers are less like the target audience.
A positive correlation between variables indicates that as the variable tested increases, consumers are more like the target audience.
I grouped features based on whether there was a negative or positive correlation to determine which features were characteristic of our target audience.
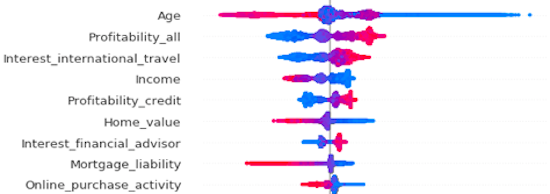
*Red indicates high feature value and blue indicates low feature value
Negative Correlation |
Positive Correlation |
|
|
Through these findings, I was able to identify clear trends.
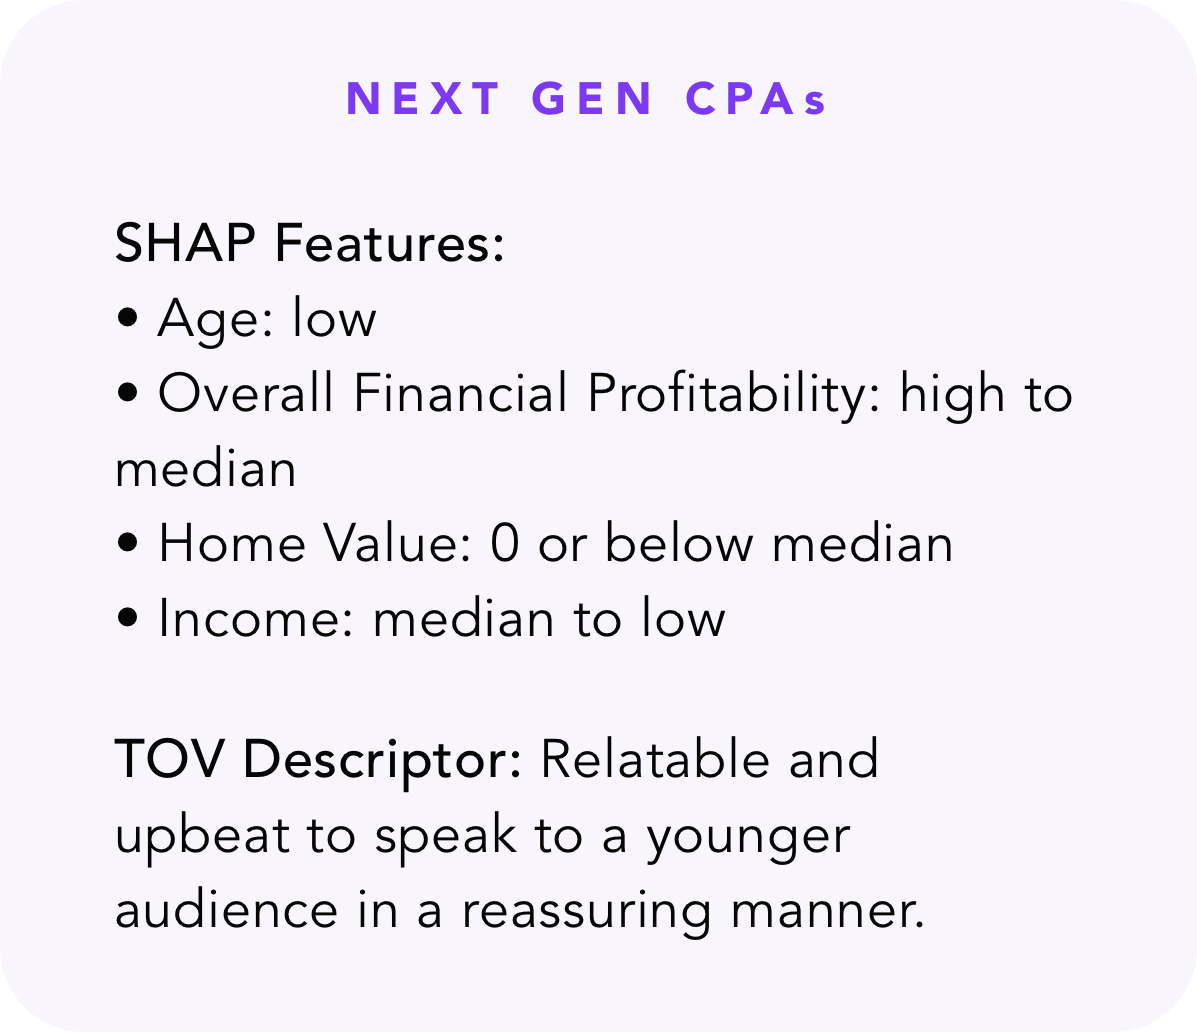
Our target audience is predominately young with a low homevalue and income.
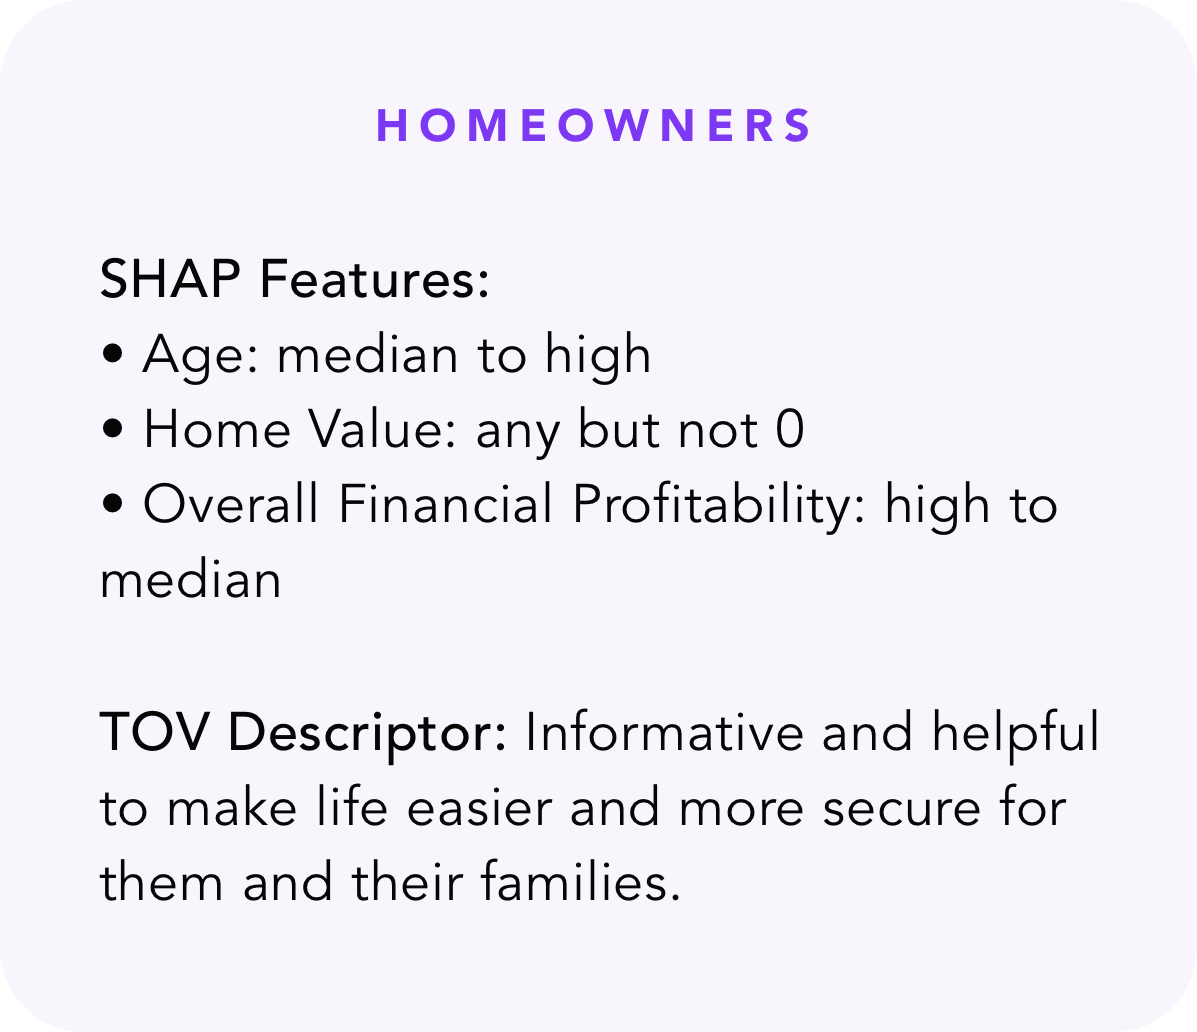
However, a segment of our target audience has a high financial profitability which can be grouped with higher age and home value.
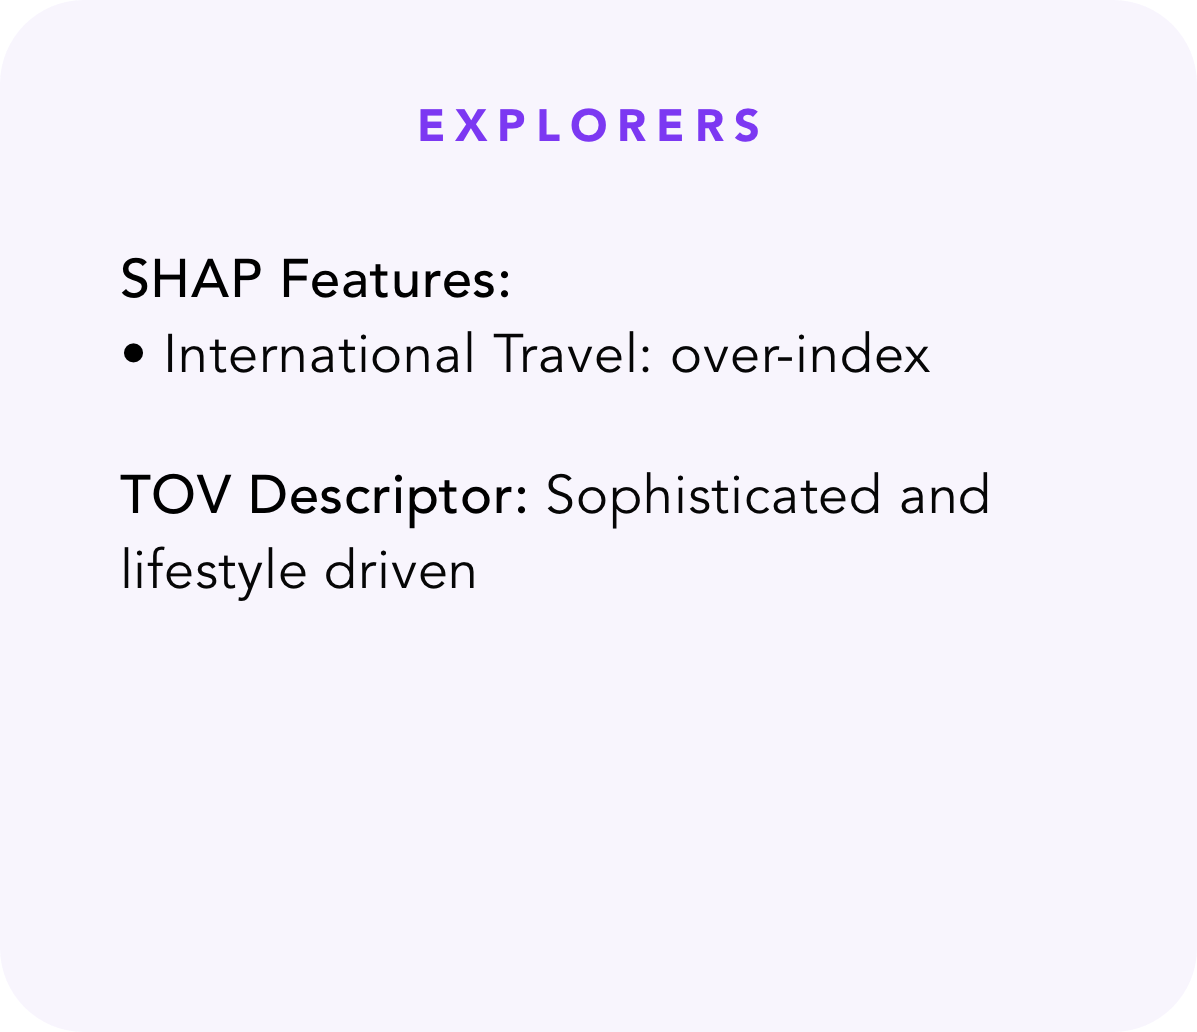
Finally, a large segment of our target audience is interested in international travel.
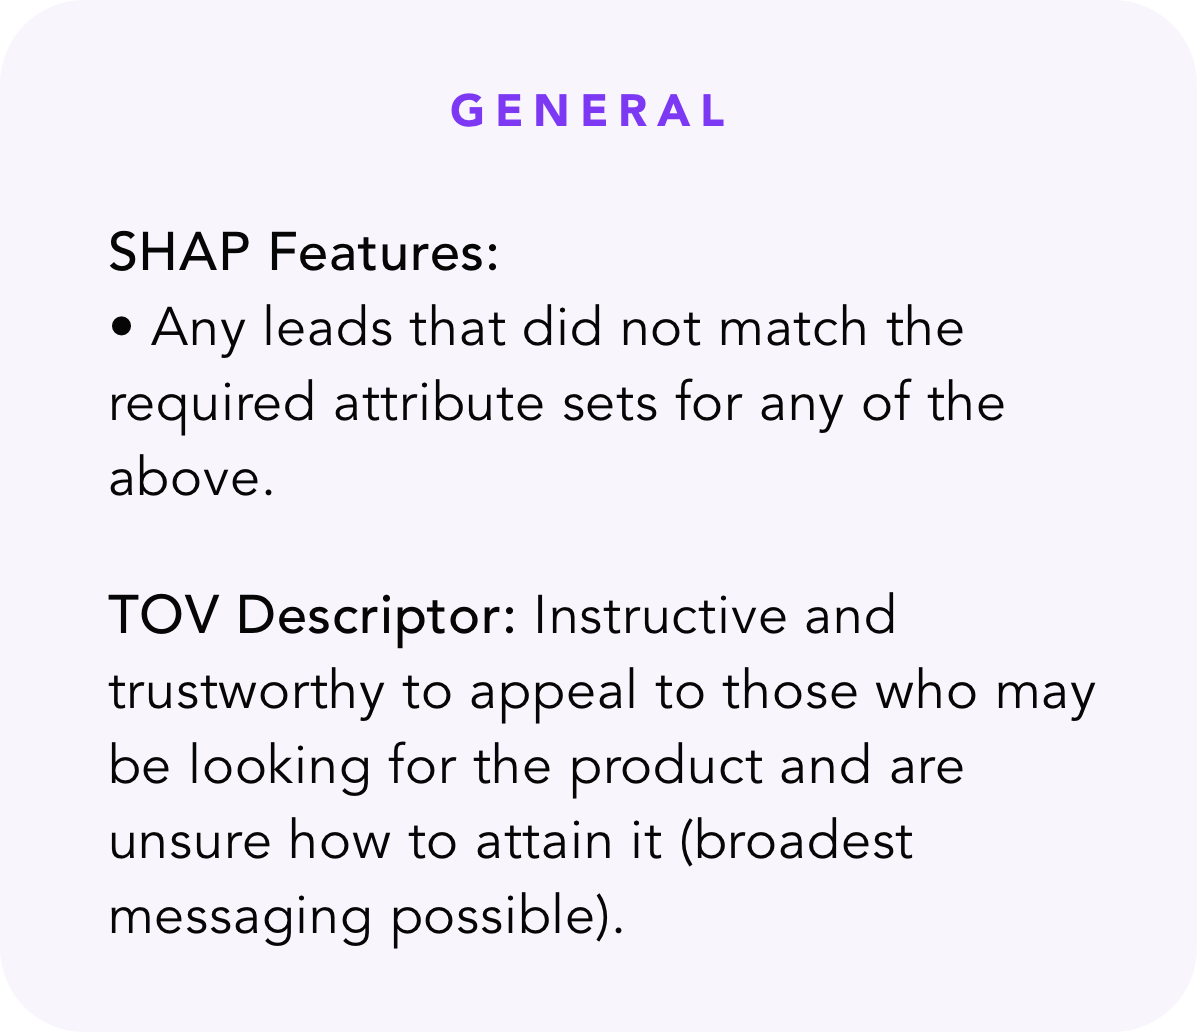
Based on this information and reasoning, the following segments and tone of voice descriptors were created:
For each segment, copy was developed using different messaging for each group based on the tone of voice descriptor and placed into email template designs.
Senior term life insurance allows policyholders to receive a payment, granted to their beneficiaries, upon death. The payment is only rewarded if the policyholder passes away during the term that their life insurance spans, typically ranging from one to 30 years. There are several reasons why one should invest in senior term life insurance such as providing funds for their funeral, granting family members an inheritance, and paying off debt and business-related financial obligations. Premiums are dependent on pre-existing medical conditions and age; those who are more at risk must pay higher rates to insure themselves. Senior term life is considerably more affordable than whole life term insurance. However, consumers must evaluate their goals and needs to determine what type of senior insurance is right for them.
For the senior term life insurance product, we could not use the SHAP value data that we analyzed for the cancer insurance product to create segments because the SHAP values reflect the entire dataset and only organization members within the age range of 50-80 are targeted for this product.
In order to better understand this niche target age range, I evaluated the significance of key features over different age groups to identify trends within the data.
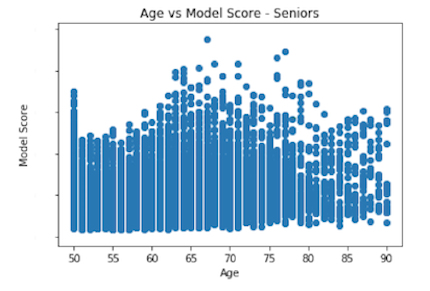
The model score for an individual quantifies the individual’s similarity to the target market.
I first identified the range of 65 to 75 as the group with the highest model score, on average, due to several outliers in the range.
*Numbers have been redacted from the graphs for privacy reasons
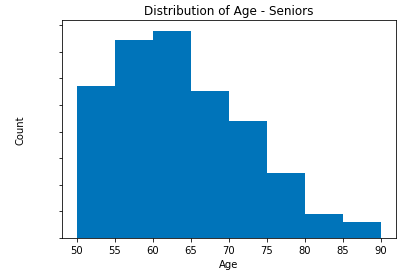
However, upon further analysis of the data, I determined that these outliers do not reflect the average of an age range and that finding the mean value for each age range is essential to accurately representing categorical trends. I wanted to understand the demographic distribution of the new market.
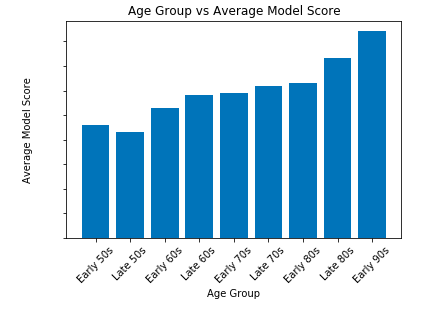
I decided to focus on 5-year age groups because my market research suggested that these groups have different needs as they are enduring different stages in their lives.
The graph is skewed right with a peak at the 60-65 bin, meaning that there is a disproportionately large number of seniors in the range 50-65 than 65-80 which was taken into consideration when determining the age bounds for segmentation.
To identify trends in the dataset, I grouped the data into 5-year bins and took the mean across the individuals in each bin for a particular feature.
I found that as age increases, model score increases, on average.
Therefore, a further analysis of the features tested against model score will be necessary to identify the similarities between the target market and a more elderly audience.
I hypothesized that as age increases, retirement rates would increase as well.
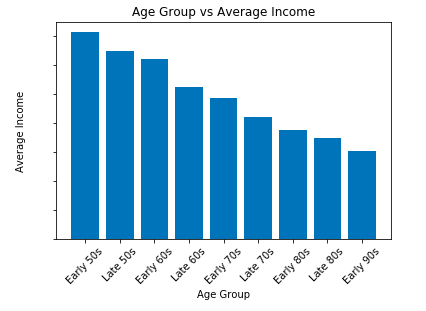
The data shows that as age increases, average income decreases.
A likely potential cause for this decrease in income is retirement, providing strong evidence to prove my hypothesis correct.
Therefore, understanding the impact of retirement on one’s decision to purchase senior term life insurance and the connotations surrounding the word to an elderly audience is essential to understanding the customers’ needs.
Although we could not interpret the SHAP value graph provided by the internal analytics team because that graph reflected the entire dataset, I was able to analyze raw SHAP values by finding the average across age groups.
Through this analysis, I was able to determine whether an increase in a particular feature indicated that these individuals are more or less like the target market.
I then used that information to test my hypotheses.
I chose several features to test, all of which were ranked high in importance and were relevant to purchasing life term insurance.
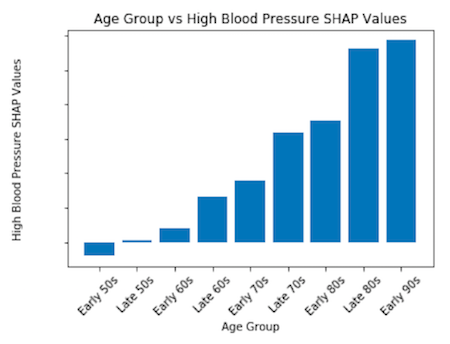
Hypothesis: As age increases, blood pressure increases.
The model proved my hypothesis correct.
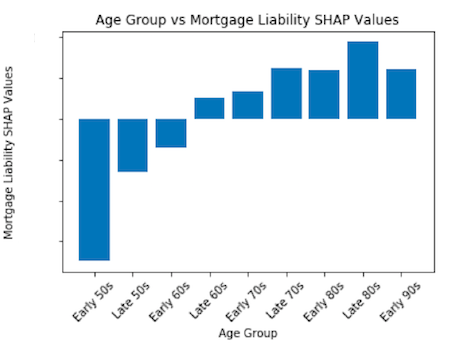
Hypothesis: As age increases, mortgage liability decreases.
The model proved my hypothesis correct.
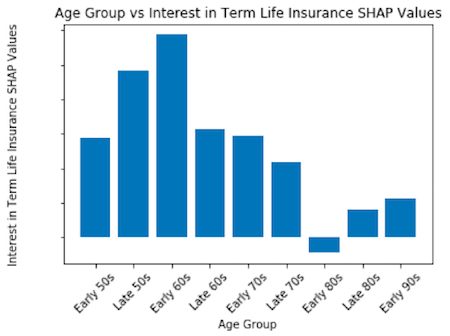
Hypothesis: As age increases, interest in insurance increases.
The model proved my hypothesis incorrect.
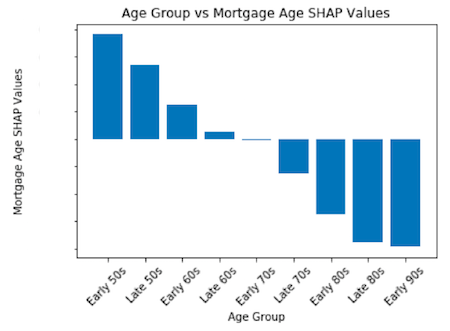
Hypothesis: As age increases, mortgage age increases.
The model proved my hypothesis correct.
Based on this information and reasoning, the following segements and tone of voice
descriptors were created:
Segment |
SHAP Features |
TOV Descriptor |
Research |
User Stories |
Young Elderly (Ages 50-64) |
|
Interested in investing in their future and reaping the long-term financial benefits of
senior term insurance for their family |
Health begins to deteriorate
Living expenses may decrease
Mandatory age of retirement increasing to 66
Begin thinking about inheritance
|
As a Young Elderly, I want to invest in senior term life insurance, so that I can support my family with expenses such as mortgage and my funeral costs after my passing.
As a Young Elderly, I want to invest in senior term life insurance at a younger age, so that I can pay lower premiums while I am still relatively healthy.
|
Old Elderly (Ages 65-80) |
|
In need of an urgent short-term solution as health rapidly declines, although may not be aware of this need
|
Good for people with a strict budget and want to prevent debts from accumulating
Whole life insurance is expensive but final expense insurance is a competitive option
Must be healthy to qualify for insurance at such an old age
|
As an Old Elderly, I want to know that my family will be supported as my health deteriorates, so that I can feel at ease during retirement |
For each segment, copy was developed using different messaging for each group based on the tone of voice descriptor and placed into email template designs.
I really enjoyed this project, especially analyzing data and thinking strategically about how to segment
members. As a UX intern, I was not anticipating to play such a large role in data analysis
but I am grateful that I had the opportunity to explore this area. I think that combining quantitiative
data with qualitative insights allowed us to understand the users holistically. I loved this
project because I was involved in all aspects of creating the email campaign which gave me a
multi-faceted experience and allowed me to explore new areas of interest.
This website was created by Chloe Kanders, Copyright 2020.